Monday, April 27, 2009

Analyzing the memory usage of your Android application


The new Android 1.5 Early Look SDK  is out since a few weeks. The "Android 1.5 highlights" page does not mention one highlight, which IMHO will become very important for all developers on the Android platform because it allows you to find memory leaks easily and analyze the memory usage of your Android applications.

I'm talking about the hprof-conv tool that allows you to convert an Android/Dalvik heap dump into an .hprof heap dump. The tool does not preserve all the information, because Dalvik has some unique features such as cross-process data sharing, that are not available in a "standard" JVM. Still the .hprof file is a good starting point and can be read with the Eclipse Memory Analyzer, which will interpret it like a normal file from a Sun 32 bit JVM. In the future it should also be not that difficult to read the Dalvik heap dump format directly and provide more information for memory analysis, such as which objects are shared and also maybe how much memory is used by native Objects (haven't checked that).

How to get a heap dump

First we must of course get a heap dump. I do not yet own an Android phone, also I plan to get on this year. If you want to donate one, please let me know. Donating lot's of money would also help ;)
I therefore created the heap dump using the emulator.
I created a new avd for the 1.5 preview:

android create avd -n test -t 2
emulator -avd test

Then you can logon to the emulated phone and make sure that the /data/misc directory is writable :

adb shell
chmod 777 /data/misc
exit

Heap dumps are actually created by sending the process a SIGUSR1 (-10) signal.

adb shell ps

check for the pid of your application

adb shell kill -10 pid


You can check with

adb shell logcat

whether it works. You should see something like:

I/dalvikvm( ): threadid=7: reacting to signal 10 I/dalvikvm( ): SIGUSR1 forcing GC and HPROF dump I/dalvikvm( ): hprof: dumping VM heap to "/data/misc/heap-dump-tm- pid.hprof-hptemp". I/dalvikvm( ): hprof: dumping heap strings to "/data/misc/heap-dump-tm124026 3144-pid.hprof". I/dalvikvm( ): hprof: heap dump completed, temp file removed D/dalvikvm( ): GC freed 1292 objects / 92440 bytes in 11 sec D/dalvikvm( ): GC freed 215 objects / 9400 bytes in 963ms

now you can copy the heap dump from the (emulated) phone to the Desktop machine:

adb pull /data/misc/heap-dump-tm-pid.hprof address.hprof

Now the file you will get does not conform to the "standard" Sun .hprof format but is written in Dalvik's own format and you need to convert it:


hprof-conv heap-dump-tm-pid.hprof 4mat.hprof

Now you can use the Eclipse Memory analyzer to analyze the memory usage of your application.

Typical optimization opportunities

I described some typical issues already here in this blog for example a problem with Finalizers in Netbeans,
 or  finding "String duplicates"  in Eclipse (my favourite memory analysis trick).

You might also take the time and check all my memory related posts.

Now I would like to present you a new typical memory usage issue that I just found when playing around with the new Android cupcake 1.5 prerelease.

YouShouldHaveDoneLazyInitialization


I did a heap dump of the android gmail application and loaded it into the Eclipse Memory Analyzer.
In the histogram view I filtered the android classes:


The high number of Rect (Rectangle) objects looked suspicious to me. Also they retain not that much memory, I thought it would be interesting why such a high number of Rect instances was alive.
When checking the Rect objects I immediately saw that most of them seemed to be empty e.g. bottom=0 and left=0 and right=0 and top=0.

It seemed to me that this was the time to again use the most advanced feature in MAT. I'm talking about the OQL view, which allows you to execute SQL like queries against the objects in your heap dump.
I very rarely used this feature in the past because the standard queries are good enough almost all times and because writing your own command in Java is not that difficult.
Still here it would help me to find how many of the Rect instances where empty.

I entered

select * from android.graphics.Rect where bottom=0 and left=0 and right=0 and top=0


Which showed me that out of 1320 Rect instances 941 where "empty", which means that over 70% of the instances where "useless".
I used "immediate dominators" on the first 20 of those 941 instances, which showed me that those empty Rect instances were retained by several UI related
classes which are subclasses of android.graphics.drawable.Drawable.


I checked the source and quickly found that Drawable always instantiates a Rect using the default constructor:


public abstract class Drawable {    private int[] mStateSet = StateSet.WILD_CARD;    private int mLevel = 0;    private int mChangingConfigurations = 0;    private Rect mBounds = new Rect();


Also this issue might not increase the memory usage of gmail that much it's still a fundamental/systematic problem, which IMHO should be fixed.
Even if we would tolerate the memory overhead, we are still left with the problem that the number of objects the garbage collector has to trace during Full GC is higher than needed, which at least potentially can lead to sluggish UI.
It's also a kind of fundamental problem because all subclasses of Drawable inherit the problem.

So instead of always using the default constructor it would most likely better to use lazy initalization  and only initialize the field when it's first needed.
A copy on write strategy  could also be used by sharing an "empty" Rect instance in the beginning, which would be replaced by a new one as soon as the field is written ( haven't checked the code whether this can still be done).

Disclaimer:
This is not a sign that Android is a poor platform. This is a kind of a problem that I've seen in the past more than once and I'm sure this kind of antipattern can be found in a lot of software out there.

UPDATE:


The issue has been fixed a few hours (or minutes?) after my post!
Check
https://review.source.android.com/Gerrit#patch,sidebyside,9684,2,graphics/java/android/graphics/drawable/Drawable.java

To see how simple the change was!


Just take the Eclipse Memory Analyzer and have a look at your application(s).
May the force be with you! ;)

Update 2:
In Android 2.3 (Gingerbread) a new command is available to trigger the heap dump.
The kill command is not supported anymore.


Wednesday, April 08, 2009

Some facts about the JVM used by Google's App engine

As you probably have noticed Google has released Java support for it's App Engine!

I wrote a small servlet to find out more about which Java they are running:

java.specification.version: 1.6
java.vendor: Sun Microsystems Inc.
line.separator:

java.class.version: 50.0
java.util.logging.config.file: WEB-INF/logging.properties
java.specification.name: Java Platform API Specification
java.vendor.url: http://java.sun.com/
java.vm.version: 1.6.0_13
os.name: Linux
java.version: 1.6.0_13
java.vm.specification.version: 1.0
user.dir: /base/data/home/apps/wanlatency/1.332645732335305520
java.specification.vendor: Sun Microsystems Inc.
java.vm.specification.name: Java Virtual Machine Specification
java.vm.vendor: Sun Microsystems Inc.
file.separator: /
path.separator: :
java.vm.specification.vendor: Sun Microsystems Inc.
java.vm.name: Java HotSpot(TM) Client VM
file.encoding: ANSI_X3.4-1968
Total Memory 104857600
Free Memory 6293011

Note that the Free Memory does not change if you allocate 10Mbyte (nor the Total memory). It might therefore by faked.
Allocating 1Gbyte results in a very simplistic error.

They use jetty!


java.lang.OutOfMemoryError: Java heap space at org.kohlerm.wanTestGoogleServlet.doGet(wanTestGoogleServlet.java:24) at javax.servlet.http.HttpServlet.service(HttpServlet.java:689) at javax.servlet.http.HttpServlet.service(HttpServlet.java:802) at org.mortbay.jetty.servlet.ServletHolder.handle(ServletHolder.java:487) at org.mortbay.jetty.servlet.ServletHandler$CachedChain.doFilter(ServletHandler.java:1093) at com.google.apphosting.runtime.jetty.SaveSessionFilter.doFilter(SaveSessionFilter.java:35) at org.mortbay.jetty.servlet.ServletHandler$CachedChain.doFilter(ServletHandler.java:1084) at com.google.apphosting.utils.servlet.TransactionCleanupFilter.doFilter(TransactionCleanupFilter.java:43) at org.mortbay.jetty.servlet.ServletHandler$CachedChain.doFilter(ServletHandler.java:1084) at org.mortbay.jetty.servlet.ServletHandler.handle(ServletHandler.java:360) at org.mortbay.jetty.security.SecurityHandler.handle(SecurityHandler.java:216) at org.mortbay.jetty.servlet.SessionHandler.handle(SessionHandler.java:181) at org.mortbay.jetty.handler.ContextHandler.handle(ContextHandler.java:712) at org.mortbay.jetty.webapp.WebAppContext.handle(WebAppContext.java:405) at com.google.apphosting.runtime.jetty.AppVersionHandlerMap.handle(AppVersionHandlerMap.java:237) at org.mortbay.jetty.handler.HandlerWrapper.handle(HandlerWrapper.java:139) at org.mortbay.jetty.Server.handle(Server.java:313) at org.mortbay.jetty.HttpConnection.handleRequest(HttpConnection.java:506) at org.mortbay.jetty.HttpConnection$RequestHandler.headerComplete(HttpConnection.java:830) at com.google.apphosting.runtime.jetty.RpcRequestParser.parseAvailable(RpcRequestParser.java:63) at org.mortbay.jetty.HttpConnection.handle(HttpConnection.java:381) at com.google.apphosting.runtime.jetty.JettyServletEngineAdapter.serviceRequest(JettyServletEngineAdapter.java:125) at com.google.apphosting.runtime.JavaRuntime.handleRequest(JavaRuntime.java:235) at com.google.apphosting.base.RuntimePb$EvaluationRuntime$6.handleBlockingRequest(RuntimePb.java:4547) at com.google.apphosting.base.RuntimePb$EvaluationRuntime$6.handleBlockingRequest(RuntimePb.java:4545) at com.google.net.rpc.impl.BlockingApplicationHandler.handleRequest(BlockingApplicationHandler.java:24) at com.google.net.rpc.impl.RpcUtil.runRpcInApplication(RpcUtil.java:359) at com.google.net.rpc.impl.Server$2.run(Server.java:792) at com.google.tracing.LocalTraceSpanRunnable.run(LocalTraceSpanRunnable.java:56) at com.google.tracing.LocalTraceSpanBuilder.internalContinueSpan(LocalTraceSpanBuilder.java:489) at com.google.net.rpc.impl.Server.startRpc(Server.java:748) at com.google.net.rpc.impl.Server.processRequest(Server.java:340)


Because my "hobby" is memory usage analysis, I ran another test on the appengine and it seems you can allocate about 110Mbyte.
Allocation seems to be very slow. I first tried to allocate a byte array in 1Mbyte steps, but until it reached 100 Mbyte it would need 30 seconds "CPU time".
Maybe they persist larger blocks to disk???


Monday, March 23, 2009

Leaks are easy to find, but memory usage analysis is bit more difficult

Leaks again

Last time I talked about how easy it is to find memory leaks in Java using the dominator tree feature of the Eclipse Memory Analyzer.
If you haven't read this post, I recommend you to do so, because this post will assume that you know the meaning of the terms "retained size" and "dominator tree".


Why does this work so well? The reason is that memory leaks in Java are not really "classical" leaks in the strict sense. Let's check what Wikipedia says about memory leaks:
"many people refer to any unwanted increase in memory usage as a memory leak, even if this is not strictly accurate"

and

"Typically, a memory leak occurs because dynamically allocated memory has become unreachable."
The later cannot happen in languages such as Java that have built-in automatic garbage collection, also Ruby does not seem to be bug free in this area.

So because those leaks in Java are "only" unwanted (unbound) increase of memory usage, the typical reason for them is that people forget to remove an object out of some collection/array or a recursive data structure,such as a tree. This might sound stupid and you (and me) would of course never make such a simple mistake ;)

But look at the following example:

try
{
doSomething(thing); // does IO
collection.remove(thing);
}
catch (IOException e)
{
// should not happen
}


"thing" will not be removed if "doSomething" throws an IOException (or any other exception). OMG Joel Spolsky was right when he said:
"I consider exceptions to be no better than "goto's""

The correct way would be:
try
{
doSomething(thing); // does IO
}
catch (IOException e)
{
// should not happen
}
finally
{
collection.remove(thing);
}
So I talked enough of leaks. I promise you if you regulary analyze heap dumps taken at the end of a performance test run, after while of fixing, you will not see a lot of leaks anymore If you still think that you need to know more a about leaks. I recommend you to check this excellent tutorial.
High memory usage

You might still see high memory usage, and your users might hate that as much as leaks, because performance degradation can be similiar.

OK, why is high memory more difficult to analyze?

You might use the dominator tree to find some big objects and you might also use it to figure out some cause of high memory usage. Because it's a tree it's easy to see where the memory is used:


domtree.PNG

You just have to look at the pathes down the tree to find out where the most memory is used/retained by single objects.

But in general the dominator tree view alone (without using some advanced functions, that I will skip for now) will not help you to find the reason why for example all those Strings are there:
Strings.PNG

Fortunately there is the "immediate dominators" query in the Eclipse Memory Analyzer that is based on the dominator tree that can help here and that also is the used internally by most of the advanced queries. The "immediate dominators" query is one of the key innovations in the the Eclipse Memory Analyzer. Even the commercial Yourkit profiler does not seem to have it yet, also they now also have a dominator tree functionality.

Immediate Dominators
So what is a "immediate dominator"? Let's have look at a simple example where the "business object" of class "Order" references a LinkedList of Strings:
imm1.png
If we look at String2 first we can find the LinkedList$Entry 2 is the "closest" object hat dominates it. If we could remove LinkedList$Entry 2, the Object String 2 would also be reclaimed by the garbage collector. We say "LinkedList$Entry 2" is the immediate dominator of "Object String 2". Note that there's always one
Let's have a look at the immediate dominators up to the Order object:
imm2.png
Note that LinkedList$Entry 1 is not an immediate dominator for LinkedList$Entry 2, because after removing it there would still be links from LinkedList$Entry 0 to LinkedList$Entry 2. We can do the same for the String 0 and String 1 and we will get the dominator tree:

imm3.png

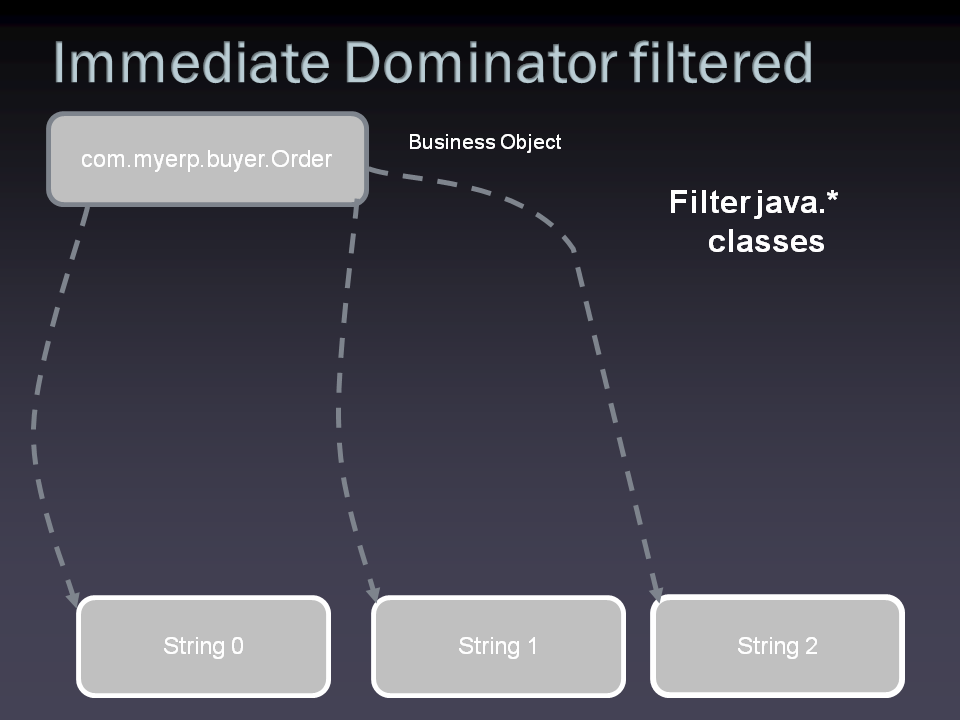
No if we ask ourself the question "why are all those Strings still there", we see that if we filter all JDK classes out of the dominator tree it's easy:
imm4.png

The immediate dominators query in MAT basically lets you walk up the dominator tree and shows you the dominators aggregated by the class:

immMAT.PNG

This is really a screenshot from an existing heap dump that I took some time ago from Eclipse. You can see for example the famous Dictionary of the spell checker plugin retaining 74393 Strings.
So now how can I find out where memory usage could be reduced?
With Strings it's pretty easy, you use the group_by_value in MAT. For the example above I applied it to the Strings dominated by ResolvedBinaryField in the first line:
group_by_value.PNG

Yes,there are really 6969 duplicates of "Ljava.lang.String;" retained only by instances of this class! Disclaimer: And no dear Netbeans "fanboys", Eclipse is not really worse than your beloved IDE in this area ;)
Strings are immutable and I wonder what would happen if people would really use more immutable data structures.

But not only Strings are interesting when you look at minimizing memory usage. Strings are just convenient because they are (usually) human readable. You can still often use Strings to find Objects which are equal but not identical, because if equal but not identical objects are created usually those objects also reference Strings that are equal but not identical.
The main question that you always have to ask yourself when trying to minimize memory usage is :

Do I need these equal but not identical objects?


In a single threaded environment the answer is usually that you don't those copies of objects.
In a highly concurrent environment, reducing the copies might introduce contention, because you have to share objects and you will need to check whether you already have this object. Strings again are relatively safe to optimize in this regard, because they are immutable, so no synchronization is needed to access them.


Having a query in MAT for the "algorithm" I described here for finding duplicated Strings, would be very helpful (there is a similiar but simpler "duplicated Strings" query already built in) .
I have done exactly that quite some time ago, but the query was not yet "production ready". There's some hope that it will appear in the standard MAT soon, stay tuned!


Monday, March 09, 2009

JavaFX's memory overhead, some (high) numbers

Lately I took a look at the TweetBox Twitter client which is build with JavaFX(© 2008-2009 Sun Microsystems). I thought it would be fun to check whether a Java based Twitter client would have less memory usage problems than those popular Adobe Air(© Adobe) based clients, such as Tweetdeck. If you search for memory leak in Twitter you will get a lot of references about Tweetdeck, which might only be caused by it's a popularity. Because JavaFX is JVM based it actually has an advantage in the area of memory usage analysis over Adobe Air.


TweetBox currently does not perform very well, but the author is working on improving it and I also tried to help him out a little bit.

When looking for memory usage using my favorite tool I was quite surprised to see the high overhead of variables in JavaFX.

Let's have a look at some numbers for the shallow size of variables (32 bit CPU):

Shallow Size

Boolean:
24 bytes (Yes, this is for one bit of information)
Integer: 24 bytes
Objects: 24 bytes
Floats: 24 bytes
Sequence: 32 bytes(never smaller than 48 bytes)


JavaFX objects seems to have a relatively large number of fields, so this overhead might be really become significant, also as always, it depends on your application. For comparsion a boolean in Java takes 1 byte and Objects have a general overhead of 8 bytes (SUN 32 bit JVM). [updated] Note that even a Boolean object in Java would in practice only require 4 Bytes for the Reference, because only 2 of them (for true and false) are needed.
An idea could be to have a native BitSet in JavaFX, which would only need one bit for each boolean value (plus a fixed overhead).

For details about the memory usage of Java objects check my post here.

But when looking at the retained size it even gets worse. Due to JavaFX's fancy binding mechanism those objects often reference other objects which causes the retained size to "explode".


Average "Retained size"

Boolean:
111 bytes

Integer: 53 bytes

Objects: 76 bytes

Floats: 53 bytes

Sequence: 84 bytes

111 bytes average (!) for a Boolean is absurdly high and I'm not sure yet whether that's because Tweetbox using it in the wrong way or because of a bug. It is caused by long chain's of com.sun.javafx.runtime.location.DynamicDependentLocation.
I have no clue what that is and even Google doesn't seem to know.

I hope JavaFX's memory usage will improve over time. Right know you have to be very careful to not run into memory usage problems.
Note that other dynamic languages on the Java stack also currently have a higher memory overhead than Java, because most of them can't directly map to the Java object model.

I assume that the footprint of JavaFX Mobile is similiar.
IMHO Googles decision to go for plain Java on it's Android platform was a smart decision


[update]: Michael Heinrichs just blogged about the difference between "def" and "var" in JavaFX Mobile.  It seems to me that "def" could help to optimize memory usage. 


Monday, February 16, 2009

Memory leaks are easy to find

Last time I talked about the dominator tree and how it can be used to find the biggest objects in your heap easily.

So what exactly is the dominator tree?

Dominators

An object A dominates on an object B if all the paths to object B pass through object A.

Remember that the Garbage Collector removes all objects that are not referenced anymore. If A dominates B and A could be removed from memory, that means that there's no path anymore that leads to B. B is therefore unreachable and would be reclaimed by the Garbage Collector.
One could also say that A is the single object that is responsible for B still being there!

The Dominator Tree

Using the the "dominates" relationship we can create a dominator tree out of the the graph of objects in memory. At each node of this tree we store the amount of memory that would be freed (= retained size).
At the top of the tree we have a "virtual" root object, which we also use to represent objects that don't have "real" single dominator.
Here's an example of an object tree (on the left) and the corresponding dominator tree (on the right) :


  1. Note that A, B and C are dominated by a "virtual" root object.
  2. Note that the dominator relationship is transitive;C dominates E which dominates G therefore C also dominates G.

Because of the transitivity of "dominated", the retained size of a parent object within the dominator tree is always greater than the sum of it's child objects.

To get the biggest objects we just need to sort the second level of the dominator tree (the first level is the "virtual" root object) by retained size.

Now if you are looking to find a memory leak, and you have no a priori knowledge that could help you, the typical approach is to run a test that reproduces the leak, and then try to somehow figure out what is leaking.

Do we really need Object allocations tracing?
In my experience people often seem to believe that finding leaks requires recording object creations, also called "object allocations tracing "sometimes, because you want to know where in the code objects are always allocates but never released.
Tess Ferrandez, ASP.NET Escalation Engineer (Microsoft) has an example of how this method for finding leaks can be applied to .NET applications. Dear Microsoft I encourage you to look at the Eclipse Memory Analyzer ;)


All you need is the dominator tree

With the dominator tree finding these kind of leaks is much easier and you don't need the high overhead of allocation tracing, which is typically not acceptable in a production environment. Allocation tracing has it's uses, but in general IMHO it is overrated.

It's almost guaranteed that a significant memory leak will show up at the very top of the dominator tree!
The Eclipse Memory Analyzer not only supports the dominator tree but can even find memory leaks automatically, based on some heuristics.

The dominator tree can also be used to find high memory usage in certain areas, which is a much harder problem. More on this in the next post.


Tuesday, February 03, 2009

How to really measure the memory usage of your objects

Measuring and analyzing the Memory consumption in Java and other OOP languages is not an easy task, because all the objects form a big highly connected graph. Only counting the flat, also called "shallow" size, of the objects, is not always helpful:


This figure shows a typical memory histogram. In general this table does not help very much to figure out which objects really cause the high memory usage. Typically String and char[] will show up in the list of the classes with the highest shallow size, just because they are frequently used.
There is probably a correlation between the high number of char[] instances and the high number of String instances(indicated by the yellow arrows), but we cannot really know from the information in the table. We also don't know whether the Order object could potentially be the root cause for all those Objects there.

So how can we find out, who is really responsible for the memory usage?

Let's take a step back and ask ourselves how Garbage Collection works in a language like Java (and also in other "modern" languages ;)).

Garbage Collection


The general idea is that the Garbage Collector will reclaim all objects that cannot be reached from a so called "GC root object".

GC root objects are
  • Local variables on the stack
  • Parameters of functions on the stack
  • JNI native references
  • All classes loaded by the bootstrap Loader
Now, let's come back to our original problem, we can ask us the interesting question:
"How much memory would be freed, if we would remove all those "Order" objects and afterwards a full GC would run?"
This would give us a measure for how much memory would be freed if those objects would not be there.
We call this measure the "retained size". The set of objects that would be freed is called the "retained set".
With the "retained set" we can figure out how many Strings would be freed if those "Order" objects would not be there. We can therefore solve the problem to find the objects "responsible" for the memory usage.

Definition "Retained size/set"


Retained set of X is the set of objects which would be collected by the GC
Retained size of X is the sum of shallow sizes of all objects in the retained set of X, i.e. memory kept alive by X.
Generally speaking, shallow size of an object is its "flat" size in the heap whereas the retained size of the same object is the amount of heap memory that will be freed when the object is garbage collected.
The retained set for a leading set of objects, such as all objects of a particular class or all objects of all classes loaded by a particular class loader or simply a bunch of arbitrary objects, is the set of objects that is released if all objects of that leading set become inaccessible. The retained set includes these objects as well as all other objects only accessible through these objects. The retained size is the total heap size of all objects contained in the retained set.

How to find the object with the biggest retained size?

The Eclipse Memory Analyzer was built from the beginning with support for computing the retained set/size of objects.
The retained size was pioneered, as far as I know, by the commercial
Yourkit profiler(great product!). When we started to develop the Eclipse Memory Analyzer (SAP Memory Analyzer at that point in time), Yourkit already had this very nice feature to find the single object with the biggest retained size. We still don't know how Yourkit does it, but for sure at that point in time they used a different approach than we do now. The reason is that it took Yourkit several minutes to get the first 10 (I think) biggest (in terms of retained size) objects in the heap. We knew that this was already still much faster than the naive method, that would have to simulate a Garbage Collector run each of the object in the heap. With millions of objects on the heap this would have taken years!

So I went on to research, what kind of Graph algorithms could help us to speed things up. After a lot of Google searches I finally found the dominator tree.

The dominator tree

The dominator tree is a datastructure that allows you to answer the question about the biggest objects in almost no time. After further research I found that it could be build in (almost) O(n) time, by a complicated algorithm invented by Lengauer and Tarjan. Since the plan by the architect of the project, was always to store precomputed information on disk, we could compute the dominator tree once and then store it on disk. Therefore opening a heap dump for the first time is a little bit slow (but still often faster than with any other tool), but opening it again is blazing fast (just a few seconds).
Still implementing the algorithm was a high risk, because at that point in time relatively new paper "Finding Dominators in Practice" was talking about graphs with at most a few thousand nodes, whereas we wanted to run it on a few millions of nodes on a 32bit machine.

Still the team would get it done (I was always only in "consultant" role), and it turned out that the dominator tree would not only allow us to speed up the process of finding the biggest objects, but would also allow us to really significantly simplify the process of finding the root causes for high memory usage.

More on this in the next post.
Stay tuned!


Monday, January 26, 2009

First Android/Dalvik heap dump loaded into the Memory Analyzer


Here you go.
I thought that Linux would be a better choice then Windows :)

Ok, to be honest the converter tool from the Dalvik format to hprof did not work on Windoof.

This is showing an old version of the SAP Memory Analyzer, because I'm lazy and no newer version was available on the Linux machine.

Thanks to Romain Guy for his assistance.
More on this tomorrow.

[update:] Could not resist and looked for duplicated Strings:


There's quite some potential for optimizations ...

Wednesday, January 07, 2009

Is java.lang.String.intern() really evil?

Domingos Neto just posted
Busting java.lang.String.intern() Myths.
In general I like the post,because I think this is an important topic, because in my experience Strings typically consume about 20% to 50% of the memory in Java applications. It's therefore important to avoid useless copies of the same String, to reduce memory usage.
But first some comments to the post above:

Myth 1: Comparing strings with == is much faster than with equals()

busted! Yes, == is faster than String.equals(), but in general it isn't near a performance improvement as it is cracked up to be.


I agree, it doesn't make sense to intern Strings to be able to use == instead of equals. But the real reason is that String.equals already does == in the first place. If your Strings are identical you automatically get the speed advantage because usually equals will be inlined!

Myth 2: String.intern() saves a lot of memory


Here I disagree. String.intern() can help you to save a lot of memory because it can be used to avoid holding duplicates of Strings in memory.
Imagine you read a lot of Strings from some File and some (or a lot) of these Strings might actually be identifiers such as the name of a City or type(class). If you don't use String.intern()(or a similiar mechanism using a Set), you will hold copies of those Strings in memory. The number of this unnecessary copies will often increase with the number of Strings you read, and therefore you will really save a significant amount of memory.


In my experience duplicated Strings are one of the most common memory usage problems in Java applications.
Check for example my blog post about the Memory usage of Netbeans versus Eclipse.


That those interned Strings end up in Perm space IMHO is not a big issue. You need to setup perm space these days to pretty high values anyway, check for example my blog post about the perm space requirements of Eclipse.
Still in the SAP JVM we also introduced a new option to store those interned Strings in the old space.
Maybe someone wants to implement this option for the OpenJDK as well ;)


Issues with String.intern()
Now you might think that String.intern() is not problematic at all, but unfortunately there are a few issues.

  • Not all JVM's have fast implementations for String.intern(). For example HP's JVM used to have problems until recently.

  • Additional contention is introduced and you have no control over it because String.intern() is native


Unfortunately I'm not aware of a good pure Java replacement for String.intern(), because what really would be needed is a memory efficient ConcurrentWeakHashSet. Such a Collection would need to use WeakReferences which have a relatively high memory overhead. Therefore my advice is still to use String.intern() if you need to avoid duplicated Strings.


Monday, December 15, 2008

How much memory is used by my Java object?

There's currently some buzz around the size of certain Java objects (Update: more on this below). Here is some very good description of what you have to take into account to compute the (shallow) size of an java object.
I repost here the rules from my old blog at SDN, because I think they are a more compact description of the memory usage for java objects.

The general rules for computing the size of an object on the SUN/SAP VM are :

32 bit

Arrays of boolean, byte, char, short, int: 2 * 4 (Object header) + 4 (length-field) + sizeof(primitiveType) * length -> align result up to a multiple of 8

Arrays of objects: 2 * 4 (Object header) + 4 (length-field) + 4 * length -> align result up to a multiple of 8

Arrays of longs and doubles: 2 * 4 (Object header) + 4 (length-field) + 4 (dead space due to alignment restrictions) + 8 * length

java.lang.Object: 2 * 4 (Object header)

other objects: sizeofSuperClass + 8 * nrOfLongAndDoubleFields + 4 * nrOfIntFloatAndObjectFields + 2 * nrOfShortAndCharFields + 1 * nrOfByteAndBooleanFields -> align result up to a multiple of 8


64 bit

Arrays of boolean, byte, char, short, int: 2 * 8 (Object header) + 4 (length-field) + sizeof(primitiveType) * length -> align result up to a multiple of 8

Arrays of objects: 2 * 8 (Object header) + 4 (length-field) + 4 (dead space due to alignment restrictions) + 8 * length

Arrays of longs and doubles: 2 * 8 (Object header) + 4 (length-field) + 4 (dead space due to alignment restrictions) + 8 * length

java.lang.Object: 2 * 8 (Object header)

other objects: sizeofSuperClass + 8 * nrOfLongDoubleAndObjectFields + 4 + nrOfntAndFloatFields + 2 * nrOfShortAndCharFields + 1 * nrOfByteAndBooleanFields -> align result up to a multiple of 8


Note that an object might have unused space due to alignment at every inheritance level (e.g. imagine a class A with just a byte field and class B has A as it's superclass and declares a byte field itself -> 14 bytes 'wasted on 64 bit system).

In practice 64 bit needs 30 to 50% more memory due to references being twice as large.


[UPDATE]


How much memory does a boolean consume?


Coming back to the question of how much a boolean consumes, yes it does consume at least one byte, but due to alignment rules it may consume much more. IMHO it is more interesting to know that a boolean[] will consume one byte per entry and not one bit,plus some overhead due to alignment and for the size field of the array. There are graph algorithms where large fields of bits are useful, and you need to be aware that, if you use a boolean[] you need almost exactly 8 times more memory than really needed (1 byte versus 1 bit).

Alternatives to boolean[]

To store large sets of booleans more efficiently a standard BitSet can be used. This will pack the bits into a compact representation that only uses one bit per entry (plus some fixed overhead)

For the Eclipse Memory Analyzer we had the need to use large fields of booleans (Millions of entries) and we know in advance how many entries we need.
We therefore implemented the class BitField that is faster than BitSet.

Still we only use this class on single core machines, because the disadvantage of it is that it is not thread save. On multicore machines we use boolean[] and I will explain in a later post how that works, because it's pretty tricky.


Note that these rules tell you only the flat (=shallow) size of an object, which is in practice pretty useless.
I will explain in my next post, how you can better measure how much memory your Java objects consume.

Thursday, November 27, 2008

Slides for my MAJUG talk about the Eclipse Memory Analyzer available

I just uploaded the Slides that I used 2 days ago at my talk for the Mannheim Java User Group (In German)
, to slideshare. There's a little bit of information lost, because of the conversion to PDF, but overall the content should be there:

Eclipse Memory Analyzer MAJUG November 2008[removed the live view because of performance problems with slideshare]


The Slides are also available from here in PDF format.

Thursday, November 06, 2008

Is Eclipse bloated? Some numbers and a first analysis

On the e4 (Eclipse 4) mailing list there were lately some discussions about whether Eclipse is bloated or not, and what could be done to minimize bloat for e4. Some summary information can be found here.

I promised to get some numbers about how much memory is used by the JIT for the classes.

I finally managed it :)

So I took Eclipse 3.5M2 (without the web tools) configured it to use the SAP JVM (which is based on SUN's Hotspot, therefore the numbers should be comparable) and used the Eclipse Memory Analyzer (plus the non open source, but free SAP extensions) to generate a csv file that I then imported into IBM's manyeyes (great stuff!) to get the data visualized as a treemap.

The numbers do not include the overhead of the compiled code cache which was around 10 Mbyte.

Here comes the memory usage(in bytes) per bundle for Eclipse 3.5M2 after clicking around to activate as many plugins as possible (a more well defined test would be good idea) :


A detailed analysis would be very time consuming, because you would need to check for a lot of classes whether there's anything that could be done to make them smaller. So for now here are just some interesting observations that I made, when quickly looking over the results:
  • 12649 classes were loaded and consumed around 64 Mbyte in Perm space
  • during the test I run out of permspace, which was configured by default to 64Mbyte and the UI would freeze :(
  • there does not seem to be any large amount of generated code, and therefore optimizing classes might be difficult
  • the help system uses JSP's (generats classes) which are relatively big, also only of few of them where in memory
  • 247 relatively big classes in org.eclipse.jdt.internal.compiler were loaded twice,once by the jasper plugin and once by the jdk core plugin
I also made a detailed (per class) visualization of the relatively large jdt bundle :


So is Eclipse really bloated?
To me it seems it's overall not very bloated. Remember that a developer PC these days probably has 2 Gbyte of RAM, so 64Mbyte hardly matter.

The help system could be probably optimizied because it uses a complete servlet implementation (Jetty) including JSP's as well as a complete Text search engine (lucene).

The heap consumption could be a bigger issue. I've seen things that you should almost always avoid like holding parsed DOM trees in memory. I may explain these issues in a later post, and I will probably show some examples in my next talk .

Tuesday, November 04, 2008

Eclipse Memory Analyzer Talk

On 25 November I will give a talk(in German) about the Eclipse Memory Analyzer at the Mannheim Java User Group.
See here for the details.

I will explain how MAT works and I also will also show some real world examples.

Monday, October 27, 2008

The knowledge about how much memory things need in Java is surprisingly low

I just came across the question "Size of a byte in memory - Java" at stackoverflow.
Ok, stackoverflow might not be the place for high quality answers, but almost nobody getting close to a meaningful answer for this day to day question, is a little bit shocking.

I documented the rules for java memory usage of the SUN JVM at my old blog 2 years ago.

I don't ask for people knowing the rules exactly (I don't either), but some feeling about where a JVM would align objects, and what kind of overhead an object has is essential Java programmers knowledge.
It's not really necessary that you know all the rules because the Eclipse Memory Analyzer knows about them.

Still, I think I understand that people might not know the details, because they are platform (32 bit versus 64 bit) as well as JVM implementation depended and have not been documented for a long time.

Not everybody has access to JVM hackers ;)


Lets come back to the question of how much a byte costs. A byte costs really 8 bits=1 byte (that is defined by the Java Spec), but the SUN JVM (on other JVM's do that as well) aligns to 8 byte.
So a it all depends on what other fields you have defined in your object. If you have 8 byte fields and nothing else everything is properly aligned and you would not waste memory.

On the other side you could add a byte field to an object and not consume more memory. You could have for example one field that only consumes 4 bytes and due to alignment you already waste for 4 bytes but adding the byte field actually costs nothing because it fills in the padded bytes.

The same is true for byte arrays, they are aligned as well and there's additional space needed for the length of the array. But for large byte arrays the average consumption is very close to one byte.


New language for Google App Engine coming before Q2/2009

There were rumors lately that Google will support Java on it's App Engine. Now at least the time frame is clear. Google just announced the roadmap for  App Engine :

10/08 - 3/09

  • Service for storing and serving large files
  • Datastore import and export utility for large datasets
  • Billing: developers can pay for more resource usage
  • Support for a new runtime language
  • Uptime monitoring site


Given that Google internally only allows to use C++, Python, Java and Javascript I think it's save to bet that either Java and/or Javascript is coming. My guess is that Java will be coming and on top of it they will offer a Rhino based web framework(Rhino on Rails).
The rational for this is that they already showed that they  can make Java work in a virtual environment. Android's Dalvik VM supports VM's running in separate processes to share data, which is something that is crucial for reducing the costs of running Java (securely) in a hosted environment. They also run some of their applications already on Java.
It's also very likely that the will support Java (at least a subset of it) because  GWT, also it can be used on the server with other languages,is Java based.

Tuesday, October 21, 2008

Funny comment in the Android sources

Android is now open source.

Just by accident I ran into the following funny comment:

98 /*

99 * Count the number of '1' bits in a word.
101 * Having completed this, I'm ready for an interview at Google.

103 * TODO? there's a parallel version w/o loops. Performance not currently
104 * important.
105 */
106 static int countOnes(u4 val)

108 int count = 0;
110 while (val != 0) {

111 val &= val-1;
112 count++;

115 return count;


:)

Support for IBM JVM's now available for the Eclipse Memory Analyzer

Just a short note.
It was just brought to my attention, that the Eclipse Memory Analyzer now also supports system dumps from IBM Virtual Machines for Java version 6, version 5.0 and version 1.4.2.

The IBM DTFJ adapter is available as an Eclipse plugin and can be downloaded from developerworks.

This is great news, because a lot of people had asked for IBM support, and because it means that MAT is now modular enough to support other Heap dump formats as well.

Maybe Google would like to support Dalvik (Android)? ;)

Monday, September 29, 2008

It's official, Neal Gafter works for Microsoft

There were already rumors that Neil Gafter would leave Google and join Microsoft.

It's now official

"I work for Microsoft on the dotNet platform languages. To balance my life, my hobby is designing and developing the future of the Java programming language."


and on twitter

"working on Microsoft Visual Studio Managed Languages with Anders Hejlsberg, on C# and other languages."


The Java Posse seems to have an interview with Neal ( I haven't checked yet).

Neal had a great influence on the Java language and lead one of the Closure proposals.
Unfortunately Closures will probably not make it into Java 7.

This is really a bad day for Java. Microsoft's .NET is already moving quickly to support new interesting languages
whereas Java is falling behind. For example, a real LINQ for Java will not be possible without closures.
With Neal working on .NET/C# Microsoft will probably advance even further.

Friday, September 19, 2008

Re: AMF vs. JSON vs. XML

Richard Monson-Haefel blogged about the advantages and disadvantages of AMF versus JSON versus XML on InsideRIA.

Also I agree with some of his points, IHMO he also misses some important ones.

For example, there is the "batch" pattern which says that it is sometimes cheaper to batch many I/O operation than to do them individually. But again using that pattern requires planning and a specific context to make it effective.

Batching is an important pattern, but the point is that the current implementations using AMF(BlazeDS) are simply Remote Procedure calls over HTTP POST.

As I said before the consequence is that BlazeDS, does not play very well with the HTTP caching infrastructure.
In short the POST's are never cached.

I just cannot see how automatic batching of RPC calls can be easily implemented. Restful API's based on JSON or XML can more easily support automatic batching and even could potentially (not sure whether the limitations of the Flex HTTPService would allow this) make use of http pipelining. Restful API's could also better use HTTP's caching features as well as lead to more scalable implementations on the server side, because to much state would be avoided there.

The truth is that performance differences between JSON and AMF are not that wide.

I agree, and would add "in practice" and "for most use cases".

I think that some benchmarks are a bit misleading. Who would really want to load that much data in one request to the client, if the client typically cannot show all the data? What you want to do is to use some kind of paging or on demand loading support, because most users in typical applications are not going to look at all the data anyway.

I bet that then the differences between the formats will become minor and probably negligible as soon as you use paging or a similar mechanism.
The reference to another performance analysis that Richard provides seems to go in this direction as well.

So at the end I would rather agree with one of the commenters on Richard's blog

Yeah, having a JSON implementation natively in Flash would be great.

There is one other requirement that you need to take into account and that is security.
Using Webservice  Remoting with authentication doesn't seem to work very well at the moment with Flex.
Therefore If you are going to use HTTP's authentication mechanism, you currently have to use BlazeDS (or the like) or use HTTPService and parse the XML manually.

Wednesday, September 10, 2008

Google Chrome tuning

Googles Chrome browser by default uses one process for each tab to isolate crashes.
This has the disadvantage that it could require more memory,because for each tab some data and code will not be shared.

Fortunately this behaviour can be configured.
Check Googles process models documentation.


You can even set Chrome to use only one process.

Monday, September 01, 2008