Showing posts with label java. Show all posts

Monday, March 23, 2009

Leaks are easy to find, but memory usage analysis is bit more difficult

Leaks again

Last time I talked about how easy it is to find memory leaks in Java using the dominator tree feature of the Eclipse Memory Analyzer.
If you haven't read this post, I recommend you to do so, because this post will assume that you know the meaning of the terms "retained size" and "dominator tree".


Why does this work so well? The reason is that memory leaks in Java are not really "classical" leaks in the strict sense. Let's check what Wikipedia says about memory leaks:
"many people refer to any unwanted increase in memory usage as a memory leak, even if this is not strictly accurate"

and

"Typically, a memory leak occurs because dynamically allocated memory has become unreachable."
The later cannot happen in languages such as Java that have built-in automatic garbage collection, also Ruby does not seem to be bug free in this area.

So because those leaks in Java are "only" unwanted (unbound) increase of memory usage, the typical reason for them is that people forget to remove an object out of some collection/array or a recursive data structure,such as a tree. This might sound stupid and you (and me) would of course never make such a simple mistake ;)

But look at the following example:

try
{
doSomething(thing); // does IO
collection.remove(thing);
}
catch (IOException e)
{
// should not happen
}


"thing" will not be removed if "doSomething" throws an IOException (or any other exception). OMG Joel Spolsky was right when he said:
"I consider exceptions to be no better than "goto's""

The correct way would be:
try
{
doSomething(thing); // does IO
}
catch (IOException e)
{
// should not happen
}
finally
{
collection.remove(thing);
}
So I talked enough of leaks. I promise you if you regulary analyze heap dumps taken at the end of a performance test run, after while of fixing, you will not see a lot of leaks anymore If you still think that you need to know more a about leaks. I recommend you to check this excellent tutorial.
High memory usage

You might still see high memory usage, and your users might hate that as much as leaks, because performance degradation can be similiar.

OK, why is high memory more difficult to analyze?

You might use the dominator tree to find some big objects and you might also use it to figure out some cause of high memory usage. Because it's a tree it's easy to see where the memory is used:


domtree.PNG

You just have to look at the pathes down the tree to find out where the most memory is used/retained by single objects.

But in general the dominator tree view alone (without using some advanced functions, that I will skip for now) will not help you to find the reason why for example all those Strings are there:
Strings.PNG

Fortunately there is the "immediate dominators" query in the Eclipse Memory Analyzer that is based on the dominator tree that can help here and that also is the used internally by most of the advanced queries. The "immediate dominators" query is one of the key innovations in the the Eclipse Memory Analyzer. Even the commercial Yourkit profiler does not seem to have it yet, also they now also have a dominator tree functionality.

Immediate Dominators
So what is a "immediate dominator"? Let's have look at a simple example where the "business object" of class "Order" references a LinkedList of Strings:
imm1.png
If we look at String2 first we can find the LinkedList$Entry 2 is the "closest" object hat dominates it. If we could remove LinkedList$Entry 2, the Object String 2 would also be reclaimed by the garbage collector. We say "LinkedList$Entry 2" is the immediate dominator of "Object String 2". Note that there's always one
Let's have a look at the immediate dominators up to the Order object:
imm2.png
Note that LinkedList$Entry 1 is not an immediate dominator for LinkedList$Entry 2, because after removing it there would still be links from LinkedList$Entry 0 to LinkedList$Entry 2. We can do the same for the String 0 and String 1 and we will get the dominator tree:

imm3.png

No if we ask ourself the question "why are all those Strings still there", we see that if we filter all JDK classes out of the dominator tree it's easy:
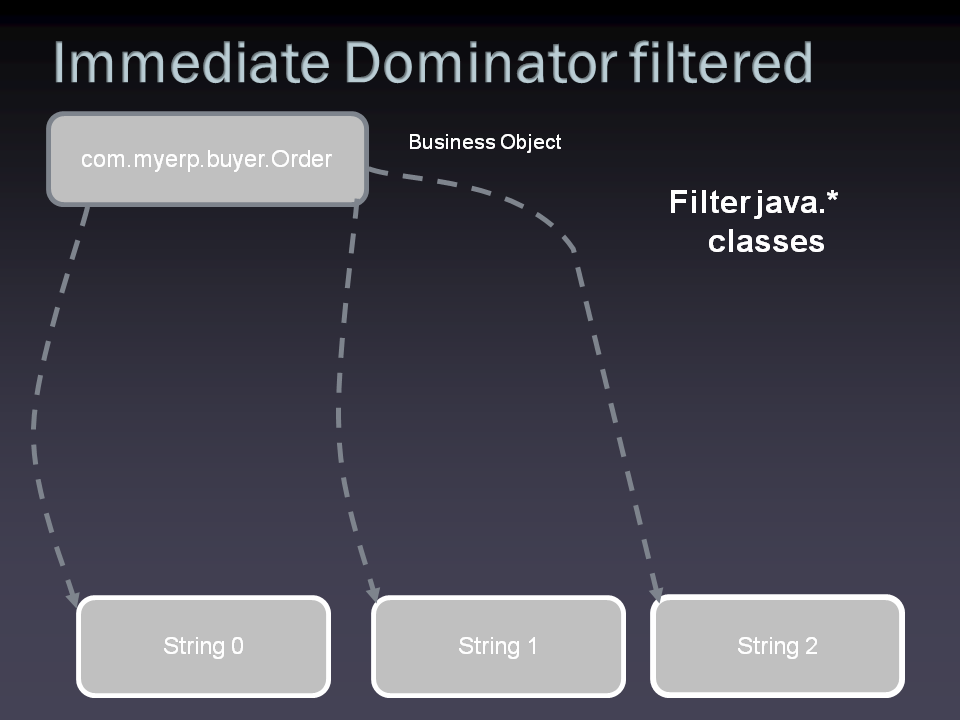
imm4.png

The immediate dominators query in MAT basically lets you walk up the dominator tree and shows you the dominators aggregated by the class:

immMAT.PNG

This is really a screenshot from an existing heap dump that I took some time ago from Eclipse. You can see for example the famous Dictionary of the spell checker plugin retaining 74393 Strings.
So now how can I find out where memory usage could be reduced?
With Strings it's pretty easy, you use the group_by_value in MAT. For the example above I applied it to the Strings dominated by ResolvedBinaryField in the first line:
group_by_value.PNG

Yes,there are really 6969 duplicates of "Ljava.lang.String;" retained only by instances of this class! Disclaimer: And no dear Netbeans "fanboys", Eclipse is not really worse than your beloved IDE in this area ;)
Strings are immutable and I wonder what would happen if people would really use more immutable data structures.

But not only Strings are interesting when you look at minimizing memory usage. Strings are just convenient because they are (usually) human readable. You can still often use Strings to find Objects which are equal but not identical, because if equal but not identical objects are created usually those objects also reference Strings that are equal but not identical.
The main question that you always have to ask yourself when trying to minimize memory usage is :

Do I need these equal but not identical objects?


In a single threaded environment the answer is usually that you don't those copies of objects.
In a highly concurrent environment, reducing the copies might introduce contention, because you have to share objects and you will need to check whether you already have this object. Strings again are relatively safe to optimize in this regard, because they are immutable, so no synchronization is needed to access them.


Having a query in MAT for the "algorithm" I described here for finding duplicated Strings, would be very helpful (there is a similiar but simpler "duplicated Strings" query already built in) .
I have done exactly that quite some time ago, but the query was not yet "production ready". There's some hope that it will appear in the standard MAT soon, stay tuned!


Monday, March 09, 2009

JavaFX's memory overhead, some (high) numbers

Lately I took a look at the TweetBox Twitter client which is build with JavaFX(© 2008-2009 Sun Microsystems). I thought it would be fun to check whether a Java based Twitter client would have less memory usage problems than those popular Adobe Air(© Adobe) based clients, such as Tweetdeck. If you search for memory leak in Twitter you will get a lot of references about Tweetdeck, which might only be caused by it's a popularity. Because JavaFX is JVM based it actually has an advantage in the area of memory usage analysis over Adobe Air.


TweetBox currently does not perform very well, but the author is working on improving it and I also tried to help him out a little bit.

When looking for memory usage using my favorite tool I was quite surprised to see the high overhead of variables in JavaFX.

Let's have a look at some numbers for the shallow size of variables (32 bit CPU):

Shallow Size

Boolean:
24 bytes (Yes, this is for one bit of information)
Integer: 24 bytes
Objects: 24 bytes
Floats: 24 bytes
Sequence: 32 bytes(never smaller than 48 bytes)


JavaFX objects seems to have a relatively large number of fields, so this overhead might be really become significant, also as always, it depends on your application. For comparsion a boolean in Java takes 1 byte and Objects have a general overhead of 8 bytes (SUN 32 bit JVM). [updated] Note that even a Boolean object in Java would in practice only require 4 Bytes for the Reference, because only 2 of them (for true and false) are needed.
An idea could be to have a native BitSet in JavaFX, which would only need one bit for each boolean value (plus a fixed overhead).

For details about the memory usage of Java objects check my post here.

But when looking at the retained size it even gets worse. Due to JavaFX's fancy binding mechanism those objects often reference other objects which causes the retained size to "explode".


Average "Retained size"

Boolean:
111 bytes

Integer: 53 bytes

Objects: 76 bytes

Floats: 53 bytes

Sequence: 84 bytes

111 bytes average (!) for a Boolean is absurdly high and I'm not sure yet whether that's because Tweetbox using it in the wrong way or because of a bug. It is caused by long chain's of com.sun.javafx.runtime.location.DynamicDependentLocation.
I have no clue what that is and even Google doesn't seem to know.

I hope JavaFX's memory usage will improve over time. Right know you have to be very careful to not run into memory usage problems.
Note that other dynamic languages on the Java stack also currently have a higher memory overhead than Java, because most of them can't directly map to the Java object model.

I assume that the footprint of JavaFX Mobile is similiar.
IMHO Googles decision to go for plain Java on it's Android platform was a smart decision


[update]: Michael Heinrichs just blogged about the difference between "def" and "var" in JavaFX Mobile.  It seems to me that "def" could help to optimize memory usage. 


Monday, February 16, 2009

Memory leaks are easy to find

Last time I talked about the dominator tree and how it can be used to find the biggest objects in your heap easily.

So what exactly is the dominator tree?

Dominators

An object A dominates on an object B if all the paths to object B pass through object A.

Remember that the Garbage Collector removes all objects that are not referenced anymore. If A dominates B and A could be removed from memory, that means that there's no path anymore that leads to B. B is therefore unreachable and would be reclaimed by the Garbage Collector.
One could also say that A is the single object that is responsible for B still being there!

The Dominator Tree

Using the the "dominates" relationship we can create a dominator tree out of the the graph of objects in memory. At each node of this tree we store the amount of memory that would be freed (= retained size).
At the top of the tree we have a "virtual" root object, which we also use to represent objects that don't have "real" single dominator.
Here's an example of an object tree (on the left) and the corresponding dominator tree (on the right) :


  1. Note that A, B and C are dominated by a "virtual" root object.
  2. Note that the dominator relationship is transitive;C dominates E which dominates G therefore C also dominates G.

Because of the transitivity of "dominated", the retained size of a parent object within the dominator tree is always greater than the sum of it's child objects.

To get the biggest objects we just need to sort the second level of the dominator tree (the first level is the "virtual" root object) by retained size.

Now if you are looking to find a memory leak, and you have no a priori knowledge that could help you, the typical approach is to run a test that reproduces the leak, and then try to somehow figure out what is leaking.

Do we really need Object allocations tracing?
In my experience people often seem to believe that finding leaks requires recording object creations, also called "object allocations tracing "sometimes, because you want to know where in the code objects are always allocates but never released.
Tess Ferrandez, ASP.NET Escalation Engineer (Microsoft) has an example of how this method for finding leaks can be applied to .NET applications. Dear Microsoft I encourage you to look at the Eclipse Memory Analyzer ;)


All you need is the dominator tree

With the dominator tree finding these kind of leaks is much easier and you don't need the high overhead of allocation tracing, which is typically not acceptable in a production environment. Allocation tracing has it's uses, but in general IMHO it is overrated.

It's almost guaranteed that a significant memory leak will show up at the very top of the dominator tree!
The Eclipse Memory Analyzer not only supports the dominator tree but can even find memory leaks automatically, based on some heuristics.

The dominator tree can also be used to find high memory usage in certain areas, which is a much harder problem. More on this in the next post.


Monday, October 27, 2008

The knowledge about how much memory things need in Java is surprisingly low

I just came across the question "Size of a byte in memory - Java" at stackoverflow.
Ok, stackoverflow might not be the place for high quality answers, but almost nobody getting close to a meaningful answer for this day to day question, is a little bit shocking.

I documented the rules for java memory usage of the SUN JVM at my old blog 2 years ago.

I don't ask for people knowing the rules exactly (I don't either), but some feeling about where a JVM would align objects, and what kind of overhead an object has is essential Java programmers knowledge.
It's not really necessary that you know all the rules because the Eclipse Memory Analyzer knows about them.

Still, I think I understand that people might not know the details, because they are platform (32 bit versus 64 bit) as well as JVM implementation depended and have not been documented for a long time.

Not everybody has access to JVM hackers ;)


Lets come back to the question of how much a byte costs. A byte costs really 8 bits=1 byte (that is defined by the Java Spec), but the SUN JVM (on other JVM's do that as well) aligns to 8 byte.
So a it all depends on what other fields you have defined in your object. If you have 8 byte fields and nothing else everything is properly aligned and you would not waste memory.

On the other side you could add a byte field to an object and not consume more memory. You could have for example one field that only consumes 4 bytes and due to alignment you already waste for 4 bytes but adding the byte field actually costs nothing because it fills in the padded bytes.

The same is true for byte arrays, they are aligned as well and there's additional space needed for the length of the array. But for large byte arrays the average consumption is very close to one byte.


Tuesday, October 21, 2008

Support for IBM JVM's now available for the Eclipse Memory Analyzer

Just a short note.
It was just brought to my attention, that the Eclipse Memory Analyzer now also supports system dumps from IBM Virtual Machines for Java version 6, version 5.0 and version 1.4.2.

The IBM DTFJ adapter is available as an Eclipse plugin and can be downloaded from developerworks.

This is great news, because a lot of people had asked for IBM support, and because it means that MAT is now modular enough to support other Heap dump formats as well.

Maybe Google would like to support Dalvik (Android)? ;)

Wednesday, June 25, 2008

Robust Java benchmarking

Doing Micro benchmarks on the JVM is very hard, due to the Hotspot compiler (assuming you are on a SUN/SAP JVM) doing very advanced optimizations at runtime.

I usually recommend to be very careful about doing any micro benchmarks without having a real JVM hacker nearby ;)

Brent Boyer has written an article series at developerworks that explains how to do it correctly and he also presents a framework to make it easier to write robust microbenchmarks :

Robust Java benchmarking, Part 1

Robust Java benchmarking, Part 2


Also I have not yet tried the framework, it looks promising.

Tuesday, June 24, 2008

Eclipse Memory Analyzer considered to be a must have tool

Philip Jacob thinks that the Eclipse Memory Analyzer is a must have tool :

I also had a little incident with a 1.5Gb heap dump yesterday. I wanted to analyze it after one of our app servers coughed it up (right before it crashed hard) to find out what the problem was. I tried jhat, which seemed to require more memory than could possibly fit into my laptop (with 4Gb). I tried Yourkit, which also stalled trying to read this large dump file (actually, Yourkit’s profiler looked pretty cool, so I shall probably revisit that). I even tried firing up jhat on an EC2 box with 15Gb of memory… but that also didn’t work. Finally, I ran across the Eclipse Memory Analyzer. Based on my previous two experiences, I didn’t expect this one to work…. but, holy cow, it did. Within just a few minutes, I had my culprit nailed (big memory leak in XStream 1.2.2) and I was much further along than I was previously.
Thanks Philip for the positive feedback!
I didn't know that EC2 supports big multi core boxes. That is very interesting because the Eclipse Memory Analyzer does take advantage of multiple cores and the available memory on 64 bit operating systems. It will "fly" on one of these boxes.

Wednesday, May 28, 2008

Memory consumption of Netbeans versus Eclipse an analysis

I recently analyzed the memory consumption of Eclipse and found that it should be easy to optimize it.

This time I will take a look at Netbeans (6.1, the Java SE pack) using the exact same setup.

First the overall memory consumption of Netbeans is only a little bit higher 24 Mbyte versus 22,7 Mbyte for eclipse :


Keep in mind that the Eclipse memory usage includes the spell checker which needs 5,6Mbyte, which can easily turned off. Without the spell checker Eclipse would need only 17,1Mbyte

The overview of the Memory Analyzer shows that the biggest memory consumer, with around 5.4 Mbyte is sun.awt.image.BufImgSurfaceData:


Swing overhead(?)

This seems to be caused by the fact that Swing uses java2d which does it's own image buffering independent of the OS. I could easily figure this out by using the Memory Analyzers "path to GC roots query":
So maybe we pay here for the platform independence of Swing?
I quickly checked using Google whether there are ways around this Image buffering, but I couldn't find any clear guidance that would avoid this. If there are Swing experts reading this, please let me know your advise.

Duplicated Strings again

Again I check for the duplicated Strings using the "group_by_value" feature of the Memory Analyzer.
Again some Strings are there many times :


This time I selected all Strings, which are there more than once, then called the "immediate dominators" query and afterwards I used the "group by package" feature in the resulting view:

This view shows you the sum of the number of duplicates in each package and therefore gives you an good overview of which packages waste the most memory because of objects keeping duplicates of Strings alive.
You can see for example that
org.netbeans.modules.java.source.parsing.FileObjects$CachedZipFileObject keeps alive a lot of duplicated Strings.
Looking at some of these objects you can for example see that one problem is the instance variable ext, which contains very often duplicates of the String "class".


Summary

So at the end we found for this probably simplistic scenario that both Netbeans and Eclipse don't consume that much memory. 24Mbyte is really not that much these days.
Eclipse seems to have a certain advantage, because turning of the spell checker is easy and then it needs almost 30% less memory than Netbeans.

To be clear, it is still much to early to declare a real winner here. My scenario is just to simple.

The only conclusion that we can draw for sure for now is, that this kind of analysis is pretty easy with the Eclipse Memory Analyzer :)

Thursday, May 22, 2008

Eclipse memory leaks?

"ecamacho" picked up my post about the memory consumption of Eclipse on the spanish website http://javahispano.org/
Google translation works pretty well for the post and the comments are quite interesting.

Leaks in Eclipse?

One question was, whether I was talking about leaks in Eclipse.
Actually I myself did not, but my colleague and project lead of the Eclipse Memory Analyzer project, "Andreas, Buchen", blogged about analyzing an actual leak in Eclipse. I can highly recommend the article, because it also shows how powerful the Memory Analyzer is.

Does turning of the Spellchecker help?

From what I have seen, yes it should help. Check http://bugs.eclipse.org/bugs/show_bug.cgi?id=233156 for the progress on the spellchecker issue.

Should we wait until the end to analyze the memory consumption of our applications?

IMHO we should not, because as we all know, fixes at the end of an software project are much more expensive than in the beginning.

I often hear :

"
premature optimization is the root of all evil."

This has been misquoted just too often.

Hoare said (according to wikipedia)

"We should forget about small efficiencies, say about 97% of the time: premature optimization is the root of all evil."

"small efficiencies"
That quote clearly doesn't say, you should not do any investigations on how much resources your applications consumes in the early phase of your project.

Actually we
have some experience with the automatic evaluation of heap dumps and we found that it pays off very well. This could be a topic for another blog post.

Monday, May 19, 2008

Analyzing the Memory Consumption of Eclipse

During my talk on May 7 at the Java User Group Karlsruhe about the Eclipse Memory Analyzer I used the latest build of Eclipse 3.4 to show live, that there's room for improvement regarding the memory consumption of Eclipse.
Today I will show you how easy this kind of analysis is with the Eclipse Memory Analyzer.

I first started Eclipse 3.4 M7 (running on JDK 1.6_10) with one project "winstone" which includes the source of the winstone project(version 0.9.10):


Then I did a heap dump using the JDK 1.6 jmap command :
Since this was a relatively small dump (around 45Mbyte) the Memory Analyzer would parse and load it in a couple of seconds :
In the "Overview" page I already found one suspect. The spellchecker (marked in red on the screen shot) takes 5.6Mbyte (24,6%) out of 22,7 Mbyte overall memory consumption!
That's certainly too much for a "non core" feature.
[update:] In the mean time submitted a bug (https://bugs.eclipse.org/bugs/show_bug.cgi?id=233156)
Looking at the spellchecker in the Dominator tree :

reveals that the implementation of the dictionary used by the Spellchecker is rather simplistic.
No Trie, no Bloom filter just a simple HashMap mapping from a String to a List of spell checked Strings :
There's certainly room for improvement here by using one of the advanced data structures mentioned above.

My favorite memory consumption analysis trick

Now comes my favorite trick, which almost always works to find some memory to optimize in a complex Java application.
I went to the histogram and checked how much String instances are retained:
12Mbyte (out of 22,7), quite a lot! Note that 4 Mbyte are from the spell checker above (not shown here, how I computed that), but that still leaves 8 Mbyte for Strings.
The next step was to call the "magic" "group by value" query on all those strings :
Which showed us how many duplicates of those Strings are there:
Duplicates of Strings everywhere

What does this table tell us? It tells us for example that there are 1988 duplicates of the same String "id" or 504 duplicates of the String "true". Yes I'm serious. Before you laugh and comment how silly this is, I recommend you to take a look at your own Java application :] In my experience (over the past few years) this is one of the most common memory consumption problems in complex java applications.
"id" or "name" for example are clearly constant unique identifiers (UID). There's simply no reason why you would want that many duplicates of UID's. I don't even have to check the source code to claim that.

Let's check which instances of which class are reponsible for these Strings.
I called the immediate dominator function on the top 30 dominated Strings :

org.eclipse.core.internal.registry.ConfigurationElement seems to cause most of the duplicates ,13.242!

If you look at the instances of the ConfigurationElement it's pretty clear. that there's a systematic problem in this class. So this should be easy to fix by using for example String.intern() or a Map to avoid the duplicates.

Bashing Eclipse?

Now you may think, that this guy is bashing Eclipse, but that's really not the case.

If you beg enough, I might also take a closer look at Netbeans :]