Memory Analyzer 1.1. was just released!
Check the New and noteworthy page and download it from here.
Showing posts with label memory analyzer. Show all posts
Showing posts with label memory analyzer. Show all posts
Wednesday, June 22, 2011


Monday, March 23, 2009
Leaks are easy to find, but memory usage analysis is bit more difficult
Leaks again
Last time I talked about how easy it is to find memory leaks in Java using the dominator tree feature of the Eclipse Memory Analyzer.
If you haven't read this post, I recommend you to do so, because this post will assume that you know the meaning of the terms "retained size" and "dominator tree".
Why does this work so well? The reason is that memory leaks in Java are not really "classical" leaks in the strict sense. Let's check what Wikipedia says about memory leaks:
So because those leaks in Java are "only" unwanted (unbound) increase of memory usage, the typical reason for them is that people forget to remove an object out of some collection/array or a recursive data structure,such as a tree. This might sound stupid and you (and me) would of course never make such a simple mistake ;)
But look at the following example:
"thing" will not be removed if "doSomething" throws an IOException (or any other exception). OMG Joel Spolsky was right when he said:
The correct way would be:
try
{
doSomething(thing); // does IO
}
catch (IOException e)
{
// should not happen
}
finally
{
collection.remove(thing);
}
So I talked enough of leaks. I promise you if you regulary analyze heap dumps taken at the end of a performance test run, after while of fixing, you will not see a lot of leaks anymore If you still think that you need to know more a about leaks. I recommend you to check this excellent tutorial.
High memory usage
You might still see high memory usage, and your users might hate that as much as leaks, because performance degradation can be similiar.
OK, why is high memory more difficult to analyze?
You might use the dominator tree to find some big objects and you might also use it to figure out some cause of high memory usage. Because it's a tree it's easy to see where the memory is used:

You just have to look at the pathes down the tree to find out where the most memory is used/retained by single objects.
But in general the dominator tree view alone (without using some advanced functions, that I will skip for now) will not help you to find the reason why for example all those Strings are there:

Fortunately there is the "immediate dominators" query in the Eclipse Memory Analyzer that is based on the dominator tree that can help here and that also is the used internally by most of the advanced queries. The "immediate dominators" query is one of the key innovations in the the Eclipse Memory Analyzer. Even the commercial Yourkit profiler does not seem to have it yet, also they now also have a dominator tree functionality.
Immediate Dominators
So what is a "immediate dominator"? Let's have look at a simple example where the "business object" of class "Order" references a LinkedList of Strings:

If we look at String2 first we can find the LinkedList$Entry 2 is the "closest" object hat dominates it. If we could remove LinkedList$Entry 2, the Object String 2 would also be reclaimed by the garbage collector. We say "LinkedList$Entry 2" is the immediate dominator of "Object String 2". Note that there's always one
Let's have a look at the immediate dominators up to the Order object:

Note that LinkedList$Entry 1 is not an immediate dominator for LinkedList$Entry 2, because after removing it there would still be links from LinkedList$Entry 0 to LinkedList$Entry 2. We can do the same for the String 0 and String 1 and we will get the dominator tree:

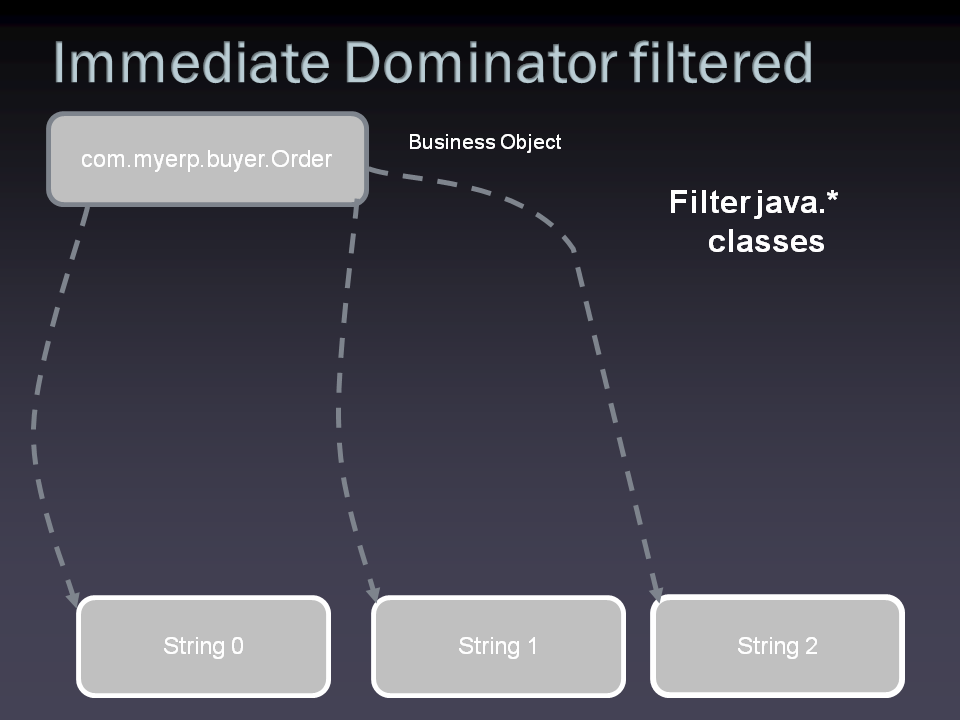
No if we ask ourself the question "why are all those Strings still there", we see that if we filter all JDK classes out of the dominator tree it's easy:
The immediate dominators query in MAT basically lets you walk up the dominator tree and shows you the dominators aggregated by the class:

This is really a screenshot from an existing heap dump that I took some time ago from Eclipse. You can see for example the famous Dictionary of the spell checker plugin retaining 74393 Strings.
So now how can I find out where memory usage could be reduced?
With Strings it's pretty easy, you use the group_by_value in MAT. For the example above I applied it to the Strings dominated by ResolvedBinaryField in the first line:

Yes,there are really 6969 duplicates of "Ljava.lang.String;" retained only by instances of this class! Disclaimer: And no dear Netbeans "fanboys", Eclipse is not really worse than your beloved IDE in this area ;)
Strings are immutable and I wonder what would happen if people would really use more immutable data structures.
But not only Strings are interesting when you look at minimizing memory usage. Strings are just convenient because they are (usually) human readable. You can still often use Strings to find Objects which are equal but not identical, because if equal but not identical objects are created usually those objects also reference Strings that are equal but not identical.
The main question that you always have to ask yourself when trying to minimize memory usage is :
Do I need these equal but not identical objects?
In a single threaded environment the answer is usually that you don't those copies of objects.
In a highly concurrent environment, reducing the copies might introduce contention, because you have to share objects and you will need to check whether you already have this object. Strings again are relatively safe to optimize in this regard, because they are immutable, so no synchronization is needed to access them.
Having a query in MAT for the "algorithm" I described here for finding duplicated Strings, would be very helpful (there is a similiar but simpler "duplicated Strings" query already built in) .
I have done exactly that quite some time ago, but the query was not yet "production ready". There's some hope that it will appear in the standard MAT soon, stay tuned!
Last time I talked about how easy it is to find memory leaks in Java using the dominator tree feature of the Eclipse Memory Analyzer.
If you haven't read this post, I recommend you to do so, because this post will assume that you know the meaning of the terms "retained size" and "dominator tree".
Why does this work so well? The reason is that memory leaks in Java are not really "classical" leaks in the strict sense. Let's check what Wikipedia says about memory leaks:
"many people refer to any unwanted increase in memory usage as a memory leak, even if this is not strictly accurate"The later cannot happen in languages such as Java that have built-in automatic garbage collection, also Ruby does not seem to be bug free in this area.
and
"Typically, a memory leak occurs because dynamically allocated memory has become unreachable."
So because those leaks in Java are "only" unwanted (unbound) increase of memory usage, the typical reason for them is that people forget to remove an object out of some collection/array or a recursive data structure,such as a tree. This might sound stupid and you (and me) would of course never make such a simple mistake ;)
But look at the following example:
try
{
doSomething(thing); // does IO
collection.remove(thing);
}
catch (IOException e)
{
// should not happen
}
"thing" will not be removed if "doSomething" throws an IOException (or any other exception). OMG Joel Spolsky was right when he said:
"I consider exceptions to be no better than "goto's""
The correct way would be:
try
{
doSomething(thing); // does IO
}
catch (IOException e)
{
// should not happen
}
finally
{
collection.remove(thing);
}
So I talked enough of leaks. I promise you if you regulary analyze heap dumps taken at the end of a performance test run, after while of fixing, you will not see a lot of leaks anymore If you still think that you need to know more a about leaks. I recommend you to check this excellent tutorial.
High memory usage
You might still see high memory usage, and your users might hate that as much as leaks, because performance degradation can be similiar.
OK, why is high memory more difficult to analyze?
You might use the dominator tree to find some big objects and you might also use it to figure out some cause of high memory usage. Because it's a tree it's easy to see where the memory is used:
You just have to look at the pathes down the tree to find out where the most memory is used/retained by single objects.
But in general the dominator tree view alone (without using some advanced functions, that I will skip for now) will not help you to find the reason why for example all those Strings are there:
Fortunately there is the "immediate dominators" query in the Eclipse Memory Analyzer that is based on the dominator tree that can help here and that also is the used internally by most of the advanced queries. The "immediate dominators" query is one of the key innovations in the the Eclipse Memory Analyzer. Even the commercial Yourkit profiler does not seem to have it yet, also they now also have a dominator tree functionality.
Immediate Dominators
So what is a "immediate dominator"? Let's have look at a simple example where the "business object" of class "Order" references a LinkedList of Strings:
If we look at String2 first we can find the LinkedList$Entry 2 is the "closest" object hat dominates it. If we could remove LinkedList$Entry 2, the Object String 2 would also be reclaimed by the garbage collector. We say "LinkedList$Entry 2" is the immediate dominator of "Object String 2". Note that there's always one
Let's have a look at the immediate dominators up to the Order object:
Note that LinkedList$Entry 1 is not an immediate dominator for LinkedList$Entry 2, because after removing it there would still be links from LinkedList$Entry 0 to LinkedList$Entry 2. We can do the same for the String 0 and String 1 and we will get the dominator tree:
No if we ask ourself the question "why are all those Strings still there", we see that if we filter all JDK classes out of the dominator tree it's easy:
The immediate dominators query in MAT basically lets you walk up the dominator tree and shows you the dominators aggregated by the class:
This is really a screenshot from an existing heap dump that I took some time ago from Eclipse. You can see for example the famous Dictionary of the spell checker plugin retaining 74393 Strings.
So now how can I find out where memory usage could be reduced?
With Strings it's pretty easy, you use the group_by_value in MAT. For the example above I applied it to the Strings dominated by ResolvedBinaryField in the first line:
Yes,there are really 6969 duplicates of "Ljava.lang.String;" retained only by instances of this class! Disclaimer: And no dear Netbeans "fanboys", Eclipse is not really worse than your beloved IDE in this area ;)
Strings are immutable and I wonder what would happen if people would really use more immutable data structures.
But not only Strings are interesting when you look at minimizing memory usage. Strings are just convenient because they are (usually) human readable. You can still often use Strings to find Objects which are equal but not identical, because if equal but not identical objects are created usually those objects also reference Strings that are equal but not identical.
The main question that you always have to ask yourself when trying to minimize memory usage is :
Do I need these equal but not identical objects?
In a single threaded environment the answer is usually that you don't those copies of objects.
In a highly concurrent environment, reducing the copies might introduce contention, because you have to share objects and you will need to check whether you already have this object. Strings again are relatively safe to optimize in this regard, because they are immutable, so no synchronization is needed to access them.
Having a query in MAT for the "algorithm" I described here for finding duplicated Strings, would be very helpful (there is a similiar but simpler "duplicated Strings" query already built in) .
I have done exactly that quite some time ago, but the query was not yet "production ready". There's some hope that it will appear in the standard MAT soon, stay tuned!
Tuesday, February 03, 2009
How to really measure the memory usage of your objects
Measuring and analyzing the Memory consumption in Java and other OOP languages is not an easy task, because all the objects form a big highly connected graph. Only counting the flat, also called "shallow" size, of the objects, is not always helpful:

This figure shows a typical memory histogram. In general this table does not help very much to figure out which objects really cause the high memory usage. Typically String and char[] will show up in the list of the classes with the highest shallow size, just because they are frequently used.
There is probably a correlation between the high number of char[] instances and the high number of String instances(indicated by the yellow arrows), but we cannot really know from the information in the table. We also don't know whether the Order object could potentially be the root cause for all those Objects there.
So how can we find out, who is really responsible for the memory usage?
Let's take a step back and ask ourselves how Garbage Collection works in a language like Java (and also in other "modern" languages ;)).
Garbage Collection
The general idea is that the Garbage Collector will reclaim all objects that cannot be reached from a so called "GC root object".
GC root objects are
"How much memory would be freed, if we would remove all those "Order" objects and afterwards a full GC would run?"
This would give us a measure for how much memory would be freed if those objects would not be there.
We call this measure the "retained size". The set of objects that would be freed is called the "retained set".
With the "retained set" we can figure out how many Strings would be freed if those "Order" objects would not be there. We can therefore solve the problem to find the objects "responsible" for the memory usage.
Definition "Retained size/set"
Retained set of X is the set of objects which would be collected by the GC
Retained size of X is the sum of shallow sizes of all objects in the retained set of X, i.e. memory kept alive by X.
Generally speaking, shallow size of an object is its "flat" size in the heap whereas the retained size of the same object is the amount of heap memory that will be freed when the object is garbage collected.
The retained set for a leading set of objects, such as all objects of a particular class or all objects of all classes loaded by a particular class loader or simply a bunch of arbitrary objects, is the set of objects that is released if all objects of that leading set become inaccessible. The retained set includes these objects as well as all other objects only accessible through these objects. The retained size is the total heap size of all objects contained in the retained set.
How to find the object with the biggest retained size?
The Eclipse Memory Analyzer was built from the beginning with support for computing the retained set/size of objects.
The retained size was pioneered, as far as I know, by the commercial
Yourkit profiler(great product!). When we started to develop the Eclipse Memory Analyzer (SAP Memory Analyzer at that point in time), Yourkit already had this very nice feature to find the single object with the biggest retained size. We still don't know how Yourkit does it, but for sure at that point in time they used a different approach than we do now. The reason is that it took Yourkit several minutes to get the first 10 (I think) biggest (in terms of retained size) objects in the heap. We knew that this was already still much faster than the naive method, that would have to simulate a Garbage Collector run each of the object in the heap. With millions of objects on the heap this would have taken years!
So I went on to research, what kind of Graph algorithms could help us to speed things up. After a lot of Google searches I finally found the dominator tree.
The dominator tree
The dominator tree is a datastructure that allows you to answer the question about the biggest objects in almost no time. After further research I found that it could be build in (almost) O(n) time, by a complicated algorithm invented by Lengauer and Tarjan. Since the plan by the architect of the project, was always to store precomputed information on disk, we could compute the dominator tree once and then store it on disk. Therefore opening a heap dump for the first time is a little bit slow (but still often faster than with any other tool), but opening it again is blazing fast (just a few seconds).
Still implementing the algorithm was a high risk, because at that point in time relatively new paper "Finding Dominators in Practice" was talking about graphs with at most a few thousand nodes, whereas we wanted to run it on a few millions of nodes on a 32bit machine.
Still the team would get it done (I was always only in "consultant" role), and it turned out that the dominator tree would not only allow us to speed up the process of finding the biggest objects, but would also allow us to really significantly simplify the process of finding the root causes for high memory usage.
More on this in the next post.
Stay tuned!

This figure shows a typical memory histogram. In general this table does not help very much to figure out which objects really cause the high memory usage. Typically String and char[] will show up in the list of the classes with the highest shallow size, just because they are frequently used.
There is probably a correlation between the high number of char[] instances and the high number of String instances(indicated by the yellow arrows), but we cannot really know from the information in the table. We also don't know whether the Order object could potentially be the root cause for all those Objects there.
So how can we find out, who is really responsible for the memory usage?
Let's take a step back and ask ourselves how Garbage Collection works in a language like Java (and also in other "modern" languages ;)).
Garbage Collection
The general idea is that the Garbage Collector will reclaim all objects that cannot be reached from a so called "GC root object".
GC root objects are
- Local variables on the stack
- Parameters of functions on the stack
- JNI native references
- All classes loaded by the bootstrap Loader
"How much memory would be freed, if we would remove all those "Order" objects and afterwards a full GC would run?"
This would give us a measure for how much memory would be freed if those objects would not be there.
We call this measure the "retained size". The set of objects that would be freed is called the "retained set".
With the "retained set" we can figure out how many Strings would be freed if those "Order" objects would not be there. We can therefore solve the problem to find the objects "responsible" for the memory usage.
Definition "Retained size/set"
Retained set of X is the set of objects which would be collected by the GC
Retained size of X is the sum of shallow sizes of all objects in the retained set of X, i.e. memory kept alive by X.
Generally speaking, shallow size of an object is its "flat" size in the heap whereas the retained size of the same object is the amount of heap memory that will be freed when the object is garbage collected.
The retained set for a leading set of objects, such as all objects of a particular class or all objects of all classes loaded by a particular class loader or simply a bunch of arbitrary objects, is the set of objects that is released if all objects of that leading set become inaccessible. The retained set includes these objects as well as all other objects only accessible through these objects. The retained size is the total heap size of all objects contained in the retained set.
How to find the object with the biggest retained size?
The Eclipse Memory Analyzer was built from the beginning with support for computing the retained set/size of objects.
The retained size was pioneered, as far as I know, by the commercial
Yourkit profiler(great product!). When we started to develop the Eclipse Memory Analyzer (SAP Memory Analyzer at that point in time), Yourkit already had this very nice feature to find the single object with the biggest retained size. We still don't know how Yourkit does it, but for sure at that point in time they used a different approach than we do now. The reason is that it took Yourkit several minutes to get the first 10 (I think) biggest (in terms of retained size) objects in the heap. We knew that this was already still much faster than the naive method, that would have to simulate a Garbage Collector run each of the object in the heap. With millions of objects on the heap this would have taken years!
So I went on to research, what kind of Graph algorithms could help us to speed things up. After a lot of Google searches I finally found the dominator tree.
The dominator tree
The dominator tree is a datastructure that allows you to answer the question about the biggest objects in almost no time. After further research I found that it could be build in (almost) O(n) time, by a complicated algorithm invented by Lengauer and Tarjan. Since the plan by the architect of the project, was always to store precomputed information on disk, we could compute the dominator tree once and then store it on disk. Therefore opening a heap dump for the first time is a little bit slow (but still often faster than with any other tool), but opening it again is blazing fast (just a few seconds).
Still implementing the algorithm was a high risk, because at that point in time relatively new paper "Finding Dominators in Practice" was talking about graphs with at most a few thousand nodes, whereas we wanted to run it on a few millions of nodes on a 32bit machine.
Still the team would get it done (I was always only in "consultant" role), and it turned out that the dominator tree would not only allow us to speed up the process of finding the biggest objects, but would also allow us to really significantly simplify the process of finding the root causes for high memory usage.
More on this in the next post.
Stay tuned!
Subscribe to:
Posts (Atom)