I recently analyzed the memory consumption of Eclipse and found that it should be easy to optimize it.
This time I will take a look at Netbeans (6.1, the Java SE pack) using the exact same setup.
First the overall memory consumption of Netbeans is only a little bit higher 24 Mbyte versus 22,7 Mbyte for eclipse :
Keep in mind that the Eclipse memory usage includes the spell checker which needs 5,6Mbyte, which can easily turned off. Without the spell checker Eclipse would need only 17,1Mbyte
The overview of the Memory Analyzer shows that the biggest memory consumer, with around 5.4 Mbyte is sun.awt.image.BufImgSurfaceData:
Swing overhead(?)
This seems to be caused by the fact that Swing uses java2d which does it's own image buffering independent of the OS. I could easily figure this out by using the Memory Analyzers "path to GC roots query":
So maybe we pay here for the platform independence of Swing?
I quickly checked using Google whether there are ways around this Image buffering, but I couldn't find any clear guidance that would avoid this. If there are Swing experts reading this, please let me know your advise.
Duplicated Strings again
Again I check for the duplicated Strings using the "group_by_value" feature of the Memory Analyzer.
Again some Strings are there many times :
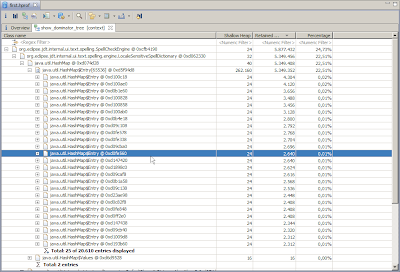
This time I selected all Strings, which are there more than once, then called the "immediate dominators" query and afterwards I used the "group by package" feature in the resulting view:
This view shows you the sum of the number of duplicates in each package and therefore gives you an good overview of which packages waste the most memory because of objects keeping duplicates of Strings alive.
You can see for example that
org.netbeans.modules.java.source.parsing.FileObjects$CachedZipFileObject keeps alive a lot of duplicated Strings.
Looking at some of these objects you can for example see that one problem is the instance variable ext, which contains very often duplicates of the String "class".
Summary
So at the end we found for this probably simplistic scenario that both Netbeans and Eclipse don't consume that much memory. 24Mbyte is really not that much these days.
Eclipse seems to have a certain advantage, because turning of the spell checker is easy and then it needs almost 30% less memory than Netbeans.
To be clear, it is still much to early to declare a real winner here. My scenario is just to simple.
The only conclusion that we can draw for sure for now is, that this kind of analysis is pretty easy with the Eclipse Memory Analyzer :)
Wednesday, May 28, 2008
Memory consumption of Netbeans versus Eclipse an analysis
Labels:
eclipse,
java,
memory,
netbeans,
performance
Gepostet von
Unknown
Thursday, May 22, 2008
Eclipse memory leaks?
"ecamacho" picked up my post about the memory consumption of Eclipse on the spanish website http://javahispano.org/
Google translation works pretty well for the post and the comments are quite interesting.
Leaks in Eclipse?
One question was, whether I was talking about leaks in Eclipse.
Actually I myself did not, but my colleague and project lead of the Eclipse Memory Analyzer project, "Andreas, Buchen", blogged about analyzing an actual leak in Eclipse. I can highly recommend the article, because it also shows how powerful the Memory Analyzer is.
Does turning of the Spellchecker help?
From what I have seen, yes it should help. Check http://bugs.eclipse.org/bugs/show_bug.cgi?id=233156 for the progress on the spellchecker issue.
Should we wait until the end to analyze the memory consumption of our applications?
IMHO we should not, because as we all know, fixes at the end of an software project are much more expensive than in the beginning.
I often hear :
"premature optimization is the root of all evil."
This has been misquoted just too often.
Hoare said (according to wikipedia)
"We should forget about small efficiencies, say about 97% of the time: premature optimization is the root of all evil."
"small efficiencies"
That quote clearly doesn't say, you should not do any investigations on how much resources your applications consumes in the early phase of your project.
Actually we have some experience with the automatic evaluation of heap dumps and we found that it pays off very well. This could be a topic for another blog post.
Labels:
java,
memory,
performance
Gepostet von
Unknown
Monday, May 19, 2008
Analyzing the Memory Consumption of Eclipse
During my talk on May 7 at the Java User Group Karlsruhe about the Eclipse Memory Analyzer I used the latest build of Eclipse 3.4 to show live, that there's room for improvement regarding the memory consumption of Eclipse.
Today I will show you how easy this kind of analysis is with the Eclipse Memory Analyzer.
I first started Eclipse 3.4 M7 (running on JDK 1.6_10) with one project "winstone" which includes the source of the winstone project(version 0.9.10):
Then I did a heap dump using the JDK 1.6 jmap command :
Since this was a relatively small dump (around 45Mbyte) the Memory Analyzer would parse and load it in a couple of seconds :
In the "Overview" page I already found one suspect. The spellchecker (marked in red on the screen shot) takes 5.6Mbyte (24,6%) out of 22,7 Mbyte overall memory consumption!
That's certainly too much for a "non core" feature.
[update:] In the mean time submitted a bug (https://bugs.eclipse.org/bugs/show_bug.cgi?id=233156)
Looking at the spellchecker in the Dominator tree :
reveals that the implementation of the dictionary used by the Spellchecker is rather simplistic.
No Trie, no Bloom filter just a simple HashMap mapping from a String to a List of spell checked Strings :
There's certainly room for improvement here by using one of the advanced data structures mentioned above.
My favorite memory consumption analysis trick
Now comes my favorite trick, which almost always works to find some memory to optimize in a complex Java application.
I went to the histogram and checked how much String instances are retained:
12Mbyte (out of 22,7), quite a lot! Note that 4 Mbyte are from the spell checker above (not shown here, how I computed that), but that still leaves 8 Mbyte for Strings.
The next step was to call the "magic" "group by value" query on all those strings :
Which showed us how many duplicates of those Strings are there:
Duplicates of Strings everywhere
What does this table tell us? It tells us for example that there are 1988 duplicates of the same String "id" or 504 duplicates of the String "true". Yes I'm serious. Before you laugh and comment how silly this is, I recommend you to take a look at your own Java application :] In my experience (over the past few years) this is one of the most common memory consumption problems in complex java applications.
"id" or "name" for example are clearly constant unique identifiers (UID). There's simply no reason why you would want that many duplicates of UID's. I don't even have to check the source code to claim that.
Let's check which instances of which class are reponsible for these Strings.
I called the immediate dominator function on the top 30 dominated Strings :
org.eclipse.core.internal.registry.ConfigurationElement seems to cause most of the duplicates ,13.242!
If you look at the instances of the ConfigurationElement it's pretty clear. that there's a systematic problem in this class. So this should be easy to fix by using for example String.intern() or a Map to avoid the duplicates.
Bashing Eclipse?
Now you may think, that this guy is bashing Eclipse, but that's really not the case.
If you beg enough, I might also take a closer look at Netbeans :]
Wednesday, May 14, 2008
GMail got faster, one trick that they didn't tell us
GMail got even faster and here are some details about how they did it :
Official Gmail Blog: A need for speed: the path to a faster loading sequence
One trick that the obviosouly did, but didn't tell us, is that they send your user name asynchronously in the background as soon as you enter the password field.
This is a GMail specific optimization. It's not available on the generic Google account page (yet?) .
My guess is that they prefetch some stuff under the assumption that most logon attempts will work. Even if the password is wrong, they minimum work, that has to be done is to check whether the account is there.
The funny thing is, that I've seen this just a few days ago, when I checked how much data Google Mail sends, to get a better feeling what would a good goal for a high performance Web application.
Regards,
Markus
Labels:
google,
performance
Gepostet von
Unknown
Subscribe to:
Posts (Atom)